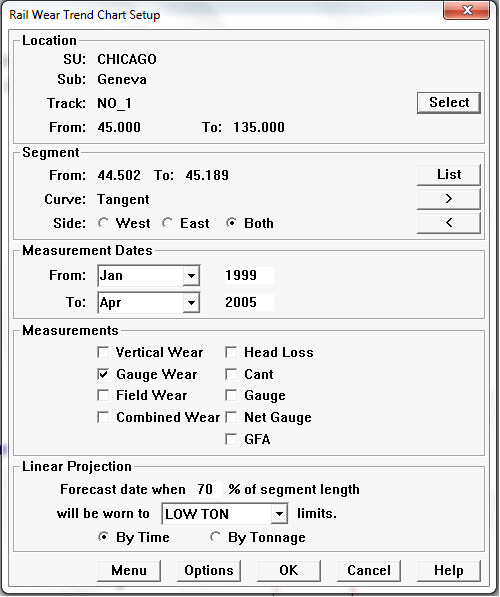
The Rail Wear Trend Chart Setup dialog is used to launch the Rail Wear Trend Chart.
Rail Wear Trend Chart Setup Dialog
The dialog is used to specify a particular curve or tangent segment, the measurements to plot, and the type of trend to calculate.
The Track segment defaults to the current run. You may select another track within the territory by clicking the Select button. A Track Segment is specified by clicking on the List button within the Segment box. A list of all the curve and tangent segments for the subdivision is presented. When a segment is selected, its track number and start and end locations are displayed in the dialog.
In order to select a different track segment from the same subdivision, click the Select button in the Location box again, or use the > and < buttons to retrieve an adjacent segment in the direction of increasing or decreasing mileage, respectively.
Use the Side buttons to display results for one or both sides of the track in a single chart.
Trends may be calculated on any one or various combinations of nine different measurements. Wear measurements are displayed in millimeters or inches, depending on the setting of the Measurement Units setting (Options/ Measurement Units from the Profile View menu). The same is true of track gauge and net gauge (although gauge units may differ from wear units). Head loss is displayed as a percentage, and cant and gauge face angle (GFA) are expressed in degrees. If measurements with different units are selected, the resulting charts will have two vertical scales: percentage on the left-hand axis and wear on the right-hand axis.
Wear limits for a selected rail classification may optionally be displayed on the trend chart. For example, in order to show the condemning limits for the dominant rail type in the track segment, use the List button to select the classification code that means "Condemned". Limits as defined in the Rail Classification table will then be displayed on the trend chart. To use this feature, limits must be recorded in the Rail Classification table. If you are using a customized rail classification macro to classify rail and you need this feature, you will have to maintain the information redundantly in the Rail Classification table.
Trends can be based on time or on accumulated tonnage. If on tonnage, tonnage records for the track location must have been recorded in the Tonnage table (Database/Tonnage... from the Profile View menu).
Trends are calculated on the basis of a least-squares fit to recorded data points. Data points may be fit to either a straight line, or a quadratic equation (2nd order polynomial). If Fit Line is selected, points are always fit to a straight line. If Fit Quadratic is selected, points are fit to a quadratic if there are three or more points; if there are only two, a line fit is used.
The Menu button allows current settings to be saved as a template to the map Reports menu. Options opens the Rail Wear Trend Chart Options dialog to allow changes to additional settings.
A chart is produced by clicking the OK button.