
Rangecam Track Analyst software is a powerful Track Maintenance Planning and Track Performance Optimization tool.
Track Analyst Enterprise includes planning tools, queries, map, charts and the ability to generate reports. Combining all of a railroad’s track test data in a single database yields additional value in the form of system-wide analysis and reports. A history of track geometry, GRMS, rail wear and rail flaw testing is a data mine from which analysis tools can extract degradation rates and other valuable information – information on which railroads can take action to optimize track maintenance practices, and extend rail and tie life.
Rangecam shows geolocation of all data on the map. It visualizes segments, mileposts, track points, defects and other data.
Map showing track, track points and track defects.
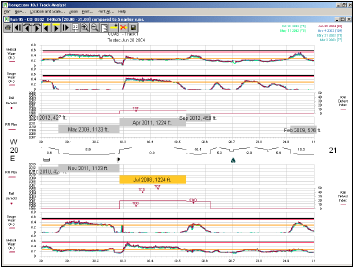
Track Analyst removes guesswork from rail replacement planning. Wear rates by time or tonnage are automatically calculated from rail wear data. The software determines when the railroad’s changeout criteria will be met for each curve. The multi-year replacement forecast is shown visually, along with the supporting rail wear data, making results easy to verify. Any available data channels can be included, including rail flaws. The plan can be changed right on the chart through a drag-and-drop interface. The final plan is exported to a spreadsheet or printed as a tabular report. Automated rail replacement planning ensures that rail replacement is done when the rail meets its changeout limits, not too early and not too late.
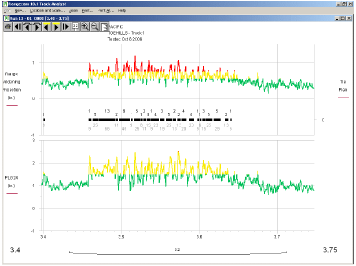
Track Analyst takes the subjectivity out of tie planning and helps ensure that maintenance dollars are spent where they are most needed. The Tie Planning Budget query and report identifies bad tie locations from GRMS data. You specify a work plan, either to replace a percentage of bad ties or to bust bad tie clusters over a given size, working by mile, by curve, or by individual cluster. You enter the tie and installation costs. You can also choose to enter a fixed budget, in which case the software automatically prioritizes tie maintenance according to railroad criteria; or you can let the software calculate the budget required. Results are shown visually, and can be output to a printable text file or to a spreadsheet. Tie counts and costs are summarized by curve and tangent segments and for the entire territory.
Performance analysis allows you to mine the data and determine causes of and cures for high wear rates. It measures the effect on rail wear rates of engineering/maintenance changes such as:
application of friction modifiers
additional lubricators
correction of curve elevation
changes in grinding profile
a change in train power distribution, e.g. from front-end to distributed power
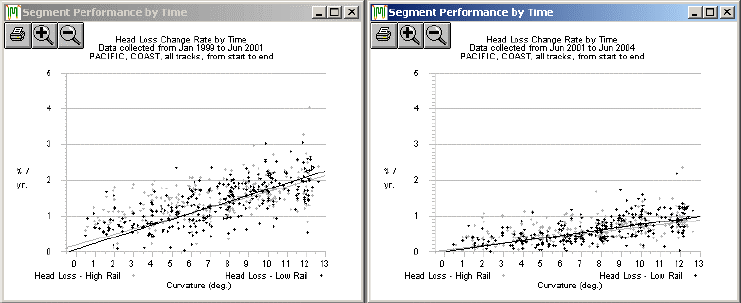
Rail wear rates before and after application of TOR friction modifiers
Improved wear rates translate directly into savings in rail replacement. They are also closely correlated with reduced fuel costs. Performance analysis allows you to measure the economic benefits of engineering changes and compare them to costs. It is the key to optimizing track performance.
Track Analyst is fully integrated with Holland's add-on Rangecam products, Grind Analyst for rail grinding planning and QA, and Wheel Analyst for wheel profile analysis, wear trending, and truing.
Track Analyst’s data is managed by industry-standard DBMS tools, ranging from MS Access for the desktop to Oracle or MS SQL Server for the Enterprise users. Database sizes range from the capacity of a CD to terabytes of track test data collected by Class 1 railroads. The database design is relational, and fully open.
Track Analyst also contains all the features of Holland's Track View, including track condition charts, rail profile display and queries, geometry queries, and a full complement of reports.