The run selected for alignment is displayed in the color defined for the Main Run. All other runs are displayed in tints or shades of the Comparison Run color.
Anchors appear as vertical bars in the color of the selected run. An anchor may be added by double-clicking on the chart at any point where no anchor bar is currently displayed. Double-clicking on an anchor bar will remove it. Normally you will want anchor bars at whole-mile locations, since they are where mile-boards are found.
Profile locations are adjusted by applying a shift to one or more anchor bars. In the simplest case, just one milepost was stamped too early or too late, or was missed altogether. If, for example, the mile stamp for milepost 159 were bad, the profiles closest to milepost 159 would show the most error. Profiles closer to the mileposts on either side, which were stamped correctly, would require a smaller shift. In this case, select the anchor bar at milepost 159 to shift it. You select an anchor bar by single-clicking on it. It will change to a contrasting color when selected.
Although the worst error in profile location is usually right under the anchor bar, it may be hard to see the magnitude of the error at that point, especially if the milepost is on tangent track. The error is most obvious at curve boundaries, where the slope of change in wear is steepest. For that reason, Rangecam allows you to correct a milepost by visually aligning a nearby curve with the curvature chart or with a comparison run.
Having selected an anchor bar, move the mouse to the boundary of a curve that you wish to shift. Click and hold down the left mouse button while dragging the mouse to a point on the chart where the curve boundary should be. Release the mouse button. The selected anchor bar will split into two, a colored bar in a new location and a black bar in the original location, connected by an arrow. The arrow shows the direction and magnitude of the shift. Profiles directly under the colored bar will be shifted to the location of the black bar. Other profiles between the selected anchor bar and the neighboring anchors, which have not been altered, will be shifted proportionately. If done accurately, the result of the proportionate shift will be the same as if the milepost had been stamped correctly in the first place.
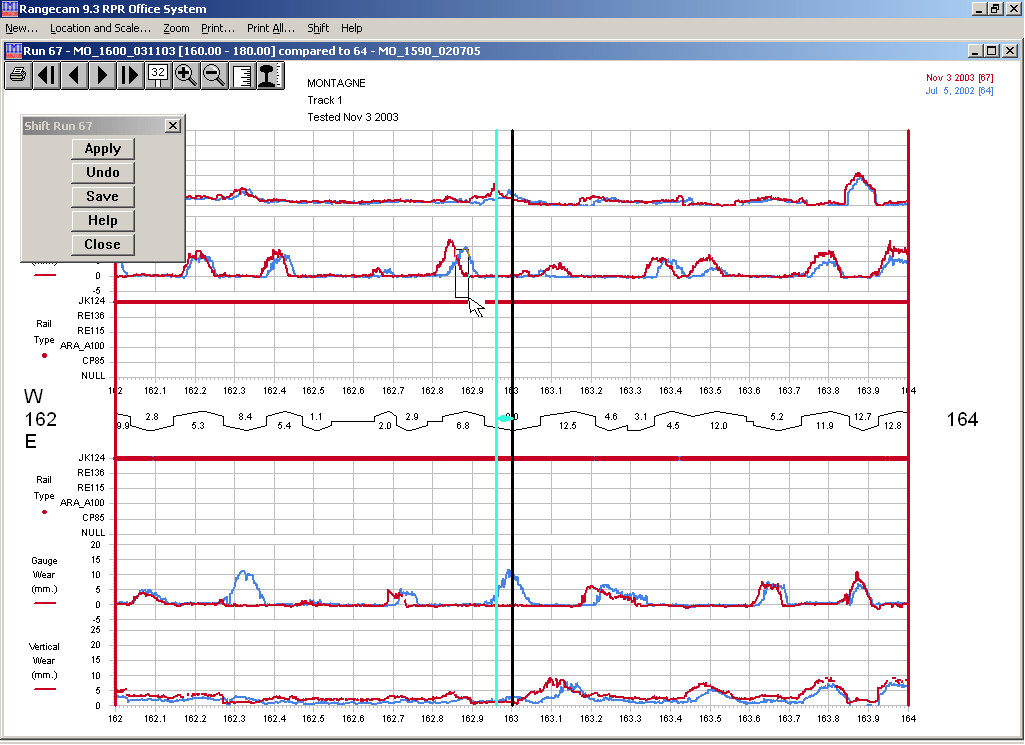
The screen should now resemble the following example:
Visual run alignment interface
In this example, Run 67 (the later run, showing more wear) has been selected for location shifting. Run 64 (earlier) is the reference run to which the later run is to be aligned. The user selected the anchor at milepost 163. When clicked on, it turned from red (the profile color) to light green (the inverse color). Next, the user marked a rectangle to shift the measurement data. Starting at the upper-left corner, the mouse was dragged down and to the right. The left-right movement when the rectangle is drawn determines the direction in which the data will be shifted, and the magnitude of the shift. In effect, what the user has done is drag the boundary of the higher-wear curve to the right, in order to align it with the lower-wear curve. (The vertical movement of the mouse has no effect on the result.)
One or more anchors may be selected and shifted in this manner. If two adjacent anchors are both shifted, the movement of profiles is harder to predict. While you are gaining practice, it is best to shift one anchor at a time.
After shifting the anchor, click the Apply button in the dialog. This will recalculate profile locations for the run, and redisplay the chart. The Apply button does not save the changes to the database; its purpose is to preview the results.
The Undo button redisplays the charts as they were prior to applying the shift.
When satisfied with the alignment, click Save to commit the changes to the database. After the location shift has been saved, it cannot be undone except by shifting and applying more anchors. If you plan major corrections to profile location, you may want to back up the database first.
The Help button provides on-line guidance. Close closes the dialog and resets the Chart window to normal viewing mode.
The navigational buttons on the Chart window may be used in location correction mode just as in normal mode. The zoom feature may also be used for increased precision.
If a shift is applied to one anchor bar among several, the movement of each profile between it and an adjacent, unshifted anchor bar is proportional to the profile's distance from the two bars. Profiles closer to the shifted anchor move further than profiles closer to the unshifted anchor. The amount each profile is shifted is the result of interpolation between the shifted and the unshifted locations.
If, on the other hand, only one anchor bar is used, then all profiles in the mileage range displayed in the chart series will be shifted by the same amount. To produce a uniform shift:
In the Shift Run dialog, choose not to anchor every mile
Create a single anchor by double-clicking anywhere on the chart
Shift the anchor
Apply the shift
All profiles in the chart series will be moved by the same distance.
Similarly, if the first or last anchor in a chart series is shifted, all profiles lying outside that anchor will be shifted by the same distance - the distance that the anchor itself is shifted.