Once you have two or more optical measurement runs from the same territory you can start reaping some of the major benefits of rail measurement by discovering how the rail changes over time. (You can also run rail replacement plans based on one run measured against the rail wear limits that are stored in the database.) You will find that some curves wear much faster than others, even though they have the same curvature and tonnage. You may find that some curves show balanced wear on the high and low rails, but others show higher vertical wear on the low rail, or excessive gauge face wear on the high rail. You can then take into account factors like track speed, lubrication, track gauge and grinding practices in order to optimize curve performance and get more life out of your rail.
Rangecam provides several tools for assessing change over time. You can overlay individual profiles from successive runs and compare them visually. You can create charts comparing rail wear for different runs. But visual comparisons only give a rough idea of how fast the rail is wearing, and when you should plan to change it out.
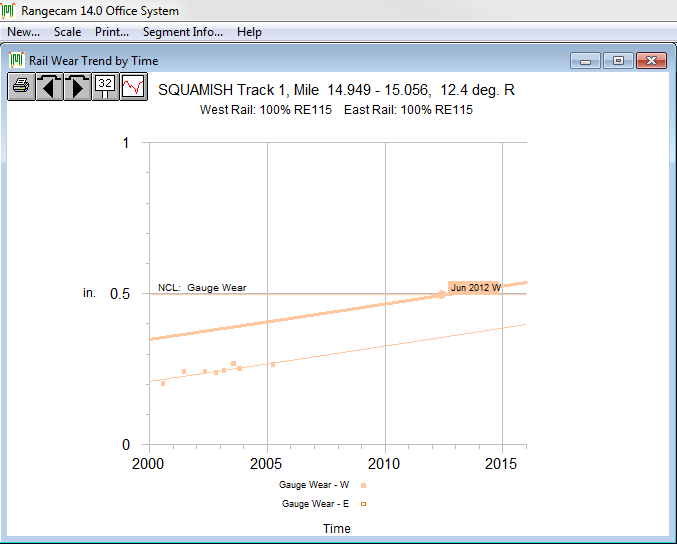
Rangecam's Wear Trend Analysis functions provide a more precise answer to these questions. Vertical wear, gauge face wear, combined wear, and percent head loss are averaged for an entire curve, for each data collection run. A percent of when the segment length will be worn to the condemning limit can also be selected. The average wear values are then plotted against time. (Alternatively, they can be plotted against accumulated tonnage, if tonnage records have been entered into the database.) The result is a trend line for each wear measurement, the slope of which is the wear rate. The date at which the fine trend lines intersect the condemning limits for the rail type is the projected change-out date for that curve; the date at which the heavy line intersects the condemning limits for the rail type shows the selected percentage of the segment length will be worn to the condemning limit.
Gauge wear rates for a curve
You can also run the Rail Replacement Forecast Report, which forecasts rail replacement dates for all curves and tangent sections in a given territory. This report also has the option of using time or tonnage-based wear rates.
Before running any of Rangecam's Wear Trend Analysis functions, you must pre-calculate average measurements for all data collection runs you wish to be used for trending. Calculation of averages is covered in Calculating Average Wear.