Charts of geometry, GRMS and rail exceptions are selected from the Track Condition Chart Setup dialog. They can be displayed stand-alone, or alongside other charts showing rail wear, geometry, etc., for a more comprehensive view of track condition.
Three types of exception are supported: rail defects, geometry and GRMS exceptions defects. For each exception type, there are two styles of chart: Defects, and Defect Index.
The Defects chart style shows the location and time each defect was discovered. Defect type is displayed above each defect.
The Defect Index style shows a cumulative exception severity index for each curve and tangent section.
If you use the Defect Index chart, you may wish to make it an overlay over the corresponding Defects chart, as is shown in this example of Rail Defects.
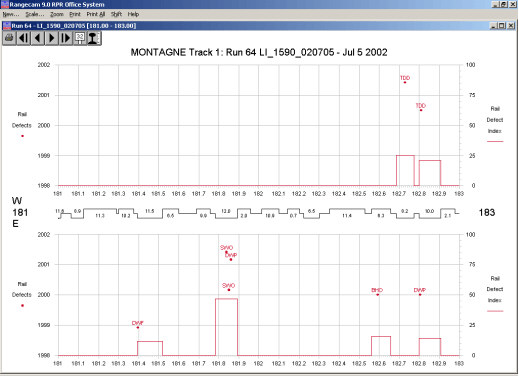
Rail defect charts.
The top and bottom charts show rail defects for the west and east rails respectively. Rail Defect Index charts have been selected as overlays on the rail defect charts. The index expresses cumulative severity of defects, per mile, per year, for each track segment. The Defect Index is calculated as di = ∑(ds) / (l x t), where:
ds: defect severity
l: track segment length
t: number of included years
Defect severity is a numeric value associated with each defect. For each track segment, the severity of all included defects is summed. The sum is divided by the segment length in miles (or alternative distance unit), and divided again by the number of years of included data.
Although this example is for rail defects, the Exception Index for geometry or for GRMS exceptions uses the same formula.
The number of years of defect data included in the index is entered in the Chart Setup Options dialog. The latest year is always the year of the most recent defect in the database. By default, this will correspond to the range of years selected for the simple defects chart.
Because there are no rail defects for the West rail for the first mile of the above example, the Rail Defect Index is zero. Towards the right, two TDD (detail fracture) defects appear, one at MP 192.73 in mid 2001, the other at MP 192.81 in 2000.
Four track segments on the East rail contain defects. The left-hand curve near the center of the screen has three: an SWO detected in 2000 and another SWO and a DWP detected in 2001. The SWO's each have a severity index of 7.5, and the DWP has severity 6, for a segment total of 21. The segment length is 0.111 miles, and 5 years of defect data are included. The index value is 21 / (0.111 x 4) = 47.
The labels of closely spaced defects may overlap. If labels are hard to read, you can space them out by using the Location and Scale... menu pick. You can also display details on individual defects by double-clicking on each defect point.