The sidebar provides primary control over what is displayed on the map. The buttons in the sidebar, such as Test Runs, Exceptions, Mileposts, etc., govern the display of different types of data on the map.
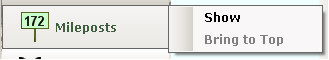
When a territory map is first created, nothing is displayed but the track. The user controls what additional data is displayed by using the sidebar. To show mileposts, for example, move the mouse to the Milepost button on the sidebar so that its menu is displayed:
Click Show to display milepost locations. You can hide them by returning to this menu and clicking Hide. When mileposts are displayed, Bring to Top will make mileposts visible by displaying them on top of other data.
The standard sidebar buttons have the following functions:
Test Runs is used to show and hide track test runs on the map. You may also select main and comparison runs for reporting using this menu. Only runs with GPS data can be displayed on the map. A window will notify the user if a selected run cannot be displayed on the map because it does not include GPS data or is not within the selected date filter range. This window provides the option to access the data through the two-up profile window.
Geom Exceptions is used to show, hide and filter geometry exceptions.
GRMS Exceptions is used to show, hide and filter GRMS exceptions.
Rail Defects is used to show, hide and filter rail flaws derived from ultrasonic testing and/or visual inspection.
Mileposts is used to show or hide the positions of track location reference posts.
Track Points is used to show or hide symbols representing wayside assets and obstacles: bridges, tunnels, switches, lubricators etc. A track point type is displayed only if it is represented by a picture in the database.
Map is used to show or hide a Google map as background to the track data. Select Normal for a map of streets and highways, Satellite for aerial imagery, Hybrid for a road map superimposed on the satellite image, or Terrain for a terrain model with elevation data. De-select the checked map to remove the Google map view from the screen. Note: Google maps are only available with a live Internet connection. Imagery may not be available for some areas at very tight zoom factors.
Reports and queries that display data on the map will dynamically create additional sidebar items. If you run a rail wear or geometry query from the map Reports menu, query results are shown, and a new sidebar button is created. Its menu is used to hide or show, bring to top, or permanently drop the query results from the map. The sidebar button for a rail wear query may also be used to generate reports.
Territory Control selects and visualizes selected territory on the map as a violet rectangular, as shown below.
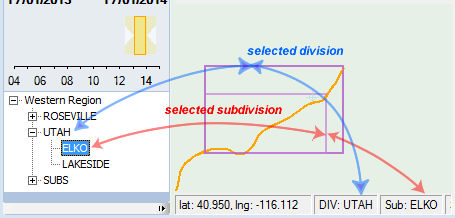
Selected territory is subdivision ELKO in division UTAH.
The root node of the tree is set to the created map territory. In the given example, it is Western Region. Territories down to track level are selectable. In the given example, ELKO and LAKESIDE are subdivisions. By selecting a territory, the user informs Rangecam of the area of interest. All reports, queries and other navigation default will be initialized with this territory. For example, if the user selected the ELKO subdivision on the map and then selected a geometry query (from the Reports menu) the initial territory will be set to ELKO.
The track also is selectable. Selected track is shown in the status bar, but it doesn't change the visual representation.