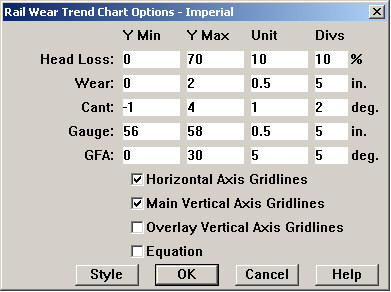
The Rail Wear Trend Chart Options dialog, reached from the Options button on the Rail Wear Trend Chart Setup dialog, allows changes to the minimum and maximum values, the size of the major and minor units defined for each measurement, grid-line display, and colors on the Rail Wear Trend Chart.
The following options may be set for all measurements:
Y Min
The lowest value of the selected measurement to be plotted. Y Min defines the bottom of the vertical chart axis.
Y Max
The highest value of the selected measurement to be plotted. Y Max defines the top of the vertical chart axis.
Unit
The size of a "major unit" on the vertical axis, that is, the space between tick marks that are labeled with measurement values. For example, if the major unit for Head Loss is defined as 5% and Y Min is 0%, then the major tick marks on the vertical axis will be labeled 0, 5, 10....
Divs
The number of divisions, or "minor units", in each "major unit". Minor units are distinguished by minor tick marks, without labels.
Grid-line display is also controlled from this dialog. Gridlines on the "major unit" marks may be turned on or off for the horizontal axis, the main (left-hand) Y-axis, and the overlay (right-hand) Y-axis.
Check Equation to display the mathematical equation of the trend line. If using linear projection, the wear rate is directly represented by the coefficient a of x in the equation y = ax + b. For example, if plotting vertical wear (in mm.) by tonnage, the equation y = 0.0354 x - 0.046 represents a wear rate of 0.0354 mm. per MGT.
Finally, the colors of line charts, and colors and shapes of scatter charts may be changed by clicking the Style button in this dialog.