The Segment Condition Chart is a variant of the Track Condition Chart, showing data for a selected curve or tangent section.
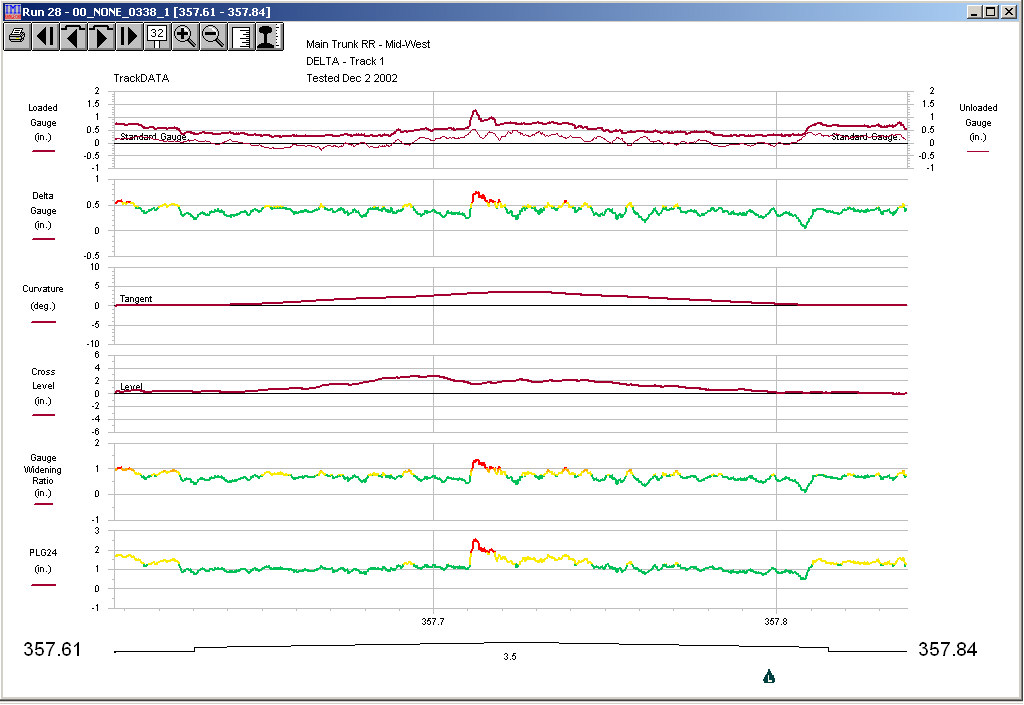
Segment Condition Chart Example
By default, the chart is scaled horizontally to the length of the curve, with a margin on both sides showing the adjacent segments. The example shows a 6.0-degree left-hand curve between a 1.5-degree left-hand and a 4.3 right-hand curve.
Most of the measurements selected in this example are related to track gauge and track strength. Delta gauge, gauge widening ratio, and projected loaded gauge are displayed in colors related to exception levels defined in the Threshold Table. To emphasize critical levels, the user has added chart bars labeled "Weak Track" and "Derailment Potential". Problem spots on the curve stand out clearly.
The picture buttons in Segment Condition Chart have slightly different functions from those of the Track Condition Chart:
![]() First (Home key) Displays the first track segment in the mileage range of the selected run.
First (Home key) Displays the first track segment in the mileage range of the selected run.
![]() Previous Segment Displays the next track segment or fixed interval in the direction of decreasing mileage.
Previous Segment Displays the next track segment or fixed interval in the direction of decreasing mileage.
![]() Next Segment Displays the next track segment or fixed interval in the direction of increasing mileage.
Next Segment Displays the next track segment or fixed interval in the direction of increasing mileage.
![]() Last (End key) Displays the last track segment in the mileage range of the selected run.
Last (End key) Displays the last track segment in the mileage range of the selected run.
![]() Location (F3 key) Allows you to jump to a specific location and/or change the horizontal scale. You may also switch between charts scaled to track segments and a fixed interval. Same as the menu item Location and Scale...
Location (F3 key) Allows you to jump to a specific location and/or change the horizontal scale. You may also switch between charts scaled to track segments and a fixed interval. Same as the menu item Location and Scale...
![]() Zoom In (Keypad + key) Zooms in to the marked region.
Zoom In (Keypad + key) Zooms in to the marked region.
![]() Zoom Out (Keypad - key) Zooms out to full-screen display.
Zoom Out (Keypad - key) Zooms out to full-screen display.
![]() Ruler (F5 key) Draws measurements on the borders of the current marked region.
Ruler (F5 key) Draws measurements on the borders of the current marked region.
![]() Calculate (F2 key) If you have used the mouse to mark a set of points on a chart, this button can be used to re-measure the selected profiles as a specified rail type.
Calculate (F2 key) If you have used the mouse to mark a set of points on a chart, this button can be used to re-measure the selected profiles as a specified rail type.
The Print All menu pick from the Segment Condition Chart allows you to print a chart page for every track segment in the mileage range of the main run. Selected page ranges can be printed.
The Segment Condition Chart can be reached from several places in the application where it makes sense to view information for a track segment:
from the Profile View menu item, Reports/Segment Condition Chart
from the Chart button on the Segment Information Dialog