Like the previous three reports, the Tie Planning Budget Summary and Tie Planning Budget Detail Reports are driven by the Geometry/GRMS Query. Choose Tie Summary from the Run/Geometry/Query/Tie Budget Planning ... drop-down menu. These reports are similar to the Tie Summary Report, with additional features that allow you to prioritize tie replacement locations, and either apply a fixed budget in priority order, or calculate the budget required to fulfill a tie replacement plan. Also, you can display your tie plan graphically in Track Segment Condition charts.
If you have selected Tie Planning Budget Summary or Detail in the Query dialog, the Options button opens this dialog:
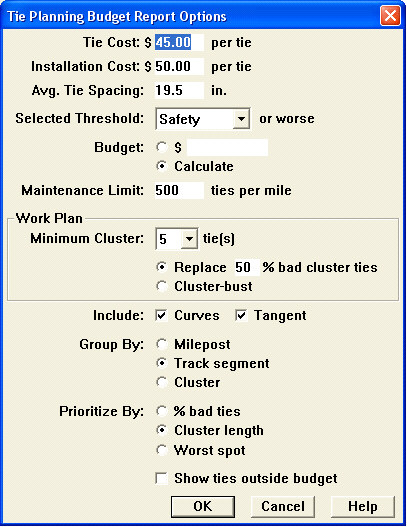
Tie Planning Budget Report Options dialog
You enter purchase cost and installation cost per tie, and spacing between ties. You define a 'bad tie' as one meeting the conditions associated with any of the exception conditions defined in the Query dialog. You can enter a fixed budget dollar amount to be allocated to tie replacement locations in priority order, or you can request that a budget total be calculated to carry out the work specified.
Maintenance Limit allows you to specify a number of ties per mile as the breakpoint between maintenance and capital programs.
Work Plan lets you choose between replacing a given percentage of all bad ties, or 'cluster-busting'. ('Cluster-busting' every 5th tie means breaking up bad-tie clusters of 5 or more by replacing every 5th tie.)
You can choose to include curves only, tangent segments only, or both.
The Group By option determines whether prioritization and budgeting are done mile-by-mile, by track segment, or by cluster.
Prioritization determines how the tie-replacement groups are prioritized. If you are applying a fixed budget, it will be allocated in priority order. Prioritization has no effect if you calculate a budget.
You can prioritize by:
highest percentage of bad ties in the group
longest cluster within the group
worst spot in the group. The worst spot is the most extreme value of the measurement on which you are querying. If your query is based on gauge widening ratio, then the tie groups with the highest maximum GWR readings will be given highest priority
The last option, Show Ties Outside Budget, allows you to include or exclude tie replacement locations that fall outside the budget. If it is checked, then all miles and/or track segments in the specified location range will be included in the report.
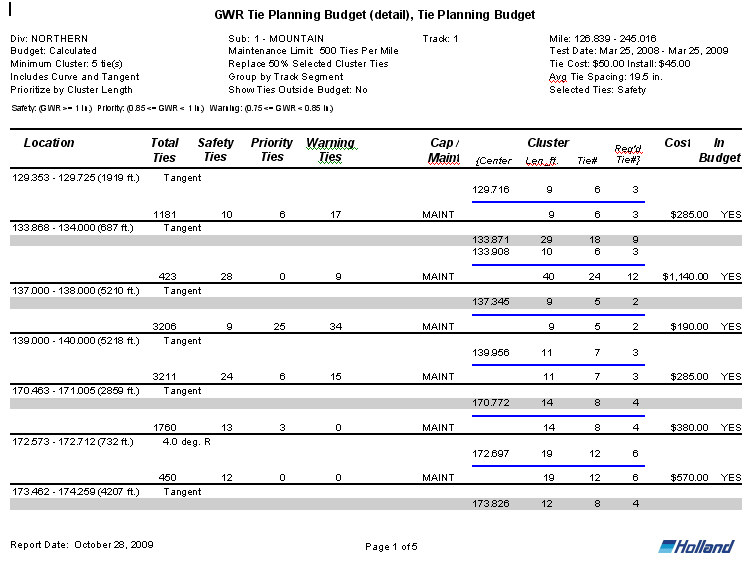
The report header contains information about the data collection run and the territory covered by the query. It also states the exception conditions and the other report options.
The report is organized as specified in the Group By option. Because Track Segment was chosen in this example, a cost is calculated for each curve and tangent. Budget is allocated to the groups in priority order. If calculate all is selected (as in this example), costs will be shown for ties that meet the selection criteria. If a budget is selected, the higher-priority groups falling within the fixed budget are indicated by "YES" in the Within Budget column on the right. Lower-priority groups are indicated by "NO". Groups with no work to be done are included in the report, but no cost figure is calculated.
The last page of the Tie Planning Budget Report contains a budget summary:
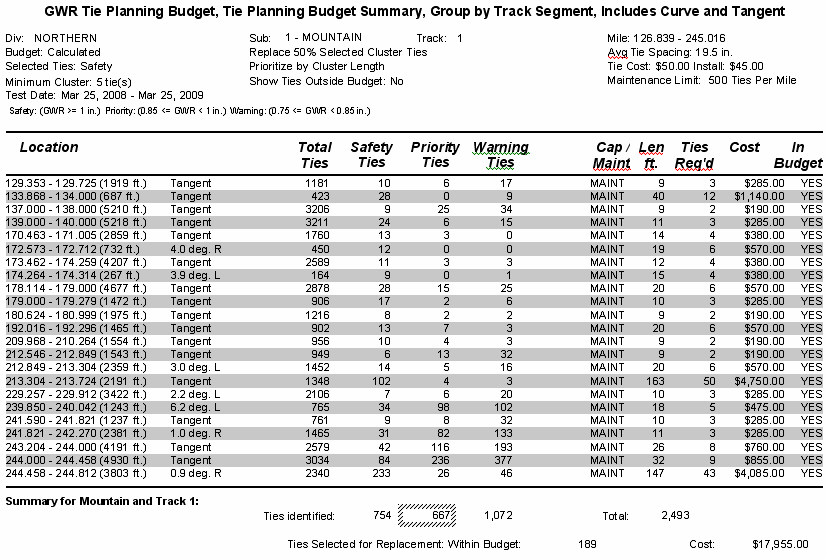 In the example, 'bad ties' were defined as ones meeting the Priority exception level or worse. The total number of bad ties for the territory is calculated as 189. To replace all of them, at a cost of $95.50 per tie (including installation) would cost $17,955. If the selected budget is less than the total cost, the budget will be allocated to the highest priority groups.