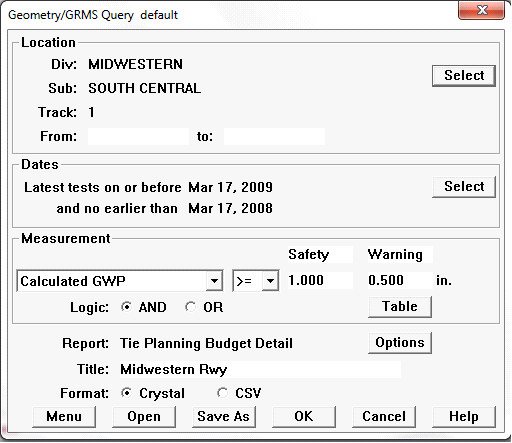
The Tie Summary Report is produced by running a Geometry/GRMS query. Choose Tie Summary from the Run/Geometry/Query/Tie Summary ... drop-down menu.
This report is intended to be used for tie planning. As such, it makes sense to drive it from a query related to tie conditions, based on gauge, gauge widening projection or gauge widening ratio.
Geometry/GRMS Query Driving the Tie Summary Report
When you select the Tie Summary report style, the Options button beside it becomes active.
Tie Summary Report Options dialog
You specify tie spacing for the territory, a minimum cluster size, and the upper limit of the number of bad ties per mile that fall within a maintenance program. (Areas with higher numbers will be marked as "Capital" on the report.) Choose Group By Milepost if you prefer a work plan based on mileposts. If you intend to work curve by curve, choose Track Segment.
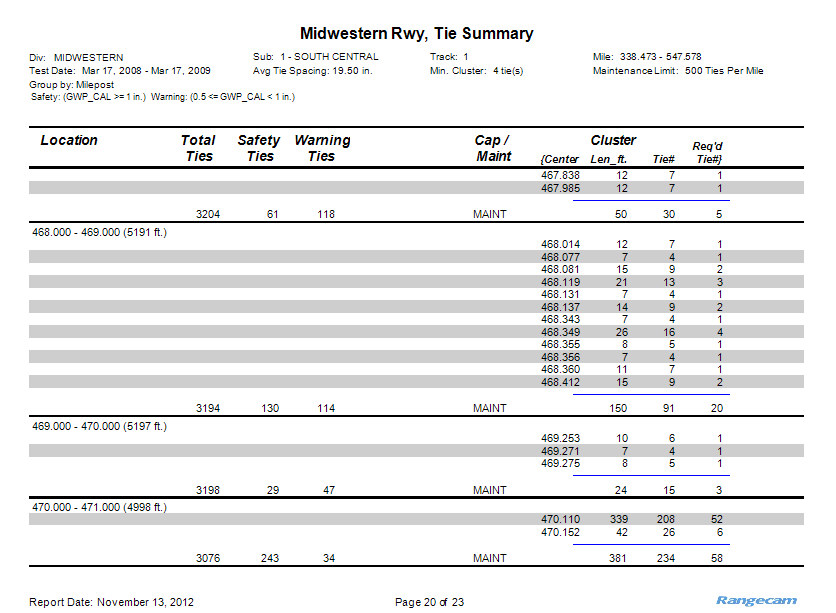
This example is grouped by mile. Total Ties is the total number of ties for each mile, based on the tie spacing entered. Safety and Warning show the number of ties of each category within the mile.
The Maint/Cap column indicates whether each segment's ratio of bad ties per mile exceeds the maintenance limit. For this report, a "bad tie" is considered one that meets the criteria for the worst exception level defined, which is "Safety" in the example.
The next four columns contain information on bad tie clusters. Again, a "bad tie" is one that meets the worst exception conditions defined. Listed are: the center locations of each cluster, its length, the number of ties in the cluster, and the number of replacement ties required to "bust" the cluster by reducing the number of consecutive bad ties below the cluster threshold. Two ties are needed to "bust" a 4-tie cluster, 4 for an 8-tie cluster, 5 for an 11-tie cluster, etc.