These picture buttons are available in the Track Condition Chart window:
![]() Print Prints
the contents of the window using default settings.
Print Prints
the contents of the window using default settings.
![]() First (Home key) Displays the first screen
of data in the selected mileage range.
First (Home key) Displays the first screen
of data in the selected mileage range.
![]() Previous (¬
key) Displays the next screen of data in the direction of decreasing
mileage. For example, if charts have been produced for a ten-mile run
at an interval of 1 mile per chart, clicking this button displays the
previous mile.
Previous (¬
key) Displays the next screen of data in the direction of decreasing
mileage. For example, if charts have been produced for a ten-mile run
at an interval of 1 mile per chart, clicking this button displays the
previous mile.
![]() Next (®
key) Displays the next screen of data in the direction of increasing
mileage. For example, if charts have been produced for a ten-mile run
at an interval of 1 mile per chart, clicking this button displays the
next mile.
Next (®
key) Displays the next screen of data in the direction of increasing
mileage. For example, if charts have been produced for a ten-mile run
at an interval of 1 mile per chart, clicking this button displays the
next mile.
![]() Last (End key) Displays the first screen
of data in the selected mileage range.
Last (End key) Displays the first screen
of data in the selected mileage range.
![]() Location (F3 key) Allows you to jump to a
specific location and/or change the horizontal scale. Same as the menu
item Location and Scale...
Location (F3 key) Allows you to jump to a
specific location and/or change the horizontal scale. Same as the menu
item Location and Scale...
![]() Zoom
In (Keypad +
key) Zooms in to the marked region.
Zoom
In (Keypad +
key) Zooms in to the marked region.
![]() Zoom
Out (Keypad -
key) Zooms out to full-screen display.
Zoom
Out (Keypad -
key) Zooms out to full-screen display.
![]() Ruler (F5 key) Draws measurements on the
borders of the current marked region.
Ruler (F5 key) Draws measurements on the
borders of the current marked region.
![]() Calculate (F2 key) If you have used the mouse
to mark a set of points on a chart, this button can be used to re-measure
the selected profiles as a specified rail type. Charts are instantly redrawn
with the re-calculated measurements.
Calculate (F2 key) If you have used the mouse
to mark a set of points on a chart, this button can be used to re-measure
the selected profiles as a specified rail type. Charts are instantly redrawn
with the re-calculated measurements.
![]() Delete (Del key) Deletes a profile from
the database if it was selected in the Rail Type strip chart. "Swipe and Delete" feature allows
the user to select multiple profiles in any profile measurement channel
by holding the left mouse button and dragging the mouse. All profiles
will be deleted at once.
Delete (Del key) Deletes a profile from
the database if it was selected in the Rail Type strip chart. "Swipe and Delete" feature allows
the user to select multiple profiles in any profile measurement channel
by holding the left mouse button and dragging the mouse. All profiles
will be deleted at once.
The keyboard may also be used to perform some common functions for which picture buttons are not provided:
Shift ¬ Scrolls the display back by 1 major location unit.
Shift ® Scrolls the display forward by 1 major location unit.
Clear key (keypad 5 with NumLock off) Clears any marked region.
The Chart window menu has the following choices:
New opens the Track Condition Chart Setup dialog to create a new set of charts.
Location and Scale This opens the Chart Location and Scale dialog, which allows the start position and horizontal chart scale to be changed dynamically without recreating the charts.
Zoom displays this submenu:
Mark zooms the Chart Window to select as much of the marked region as possible while retaining the horizontal/vertical aspect ratio. To mark a region, click and drag the mouse across the region of interest. If no region is marked, this option undoes the last zoom.
Full resets the Chart Window's zoom to its original extent.
Clear Mark This command removes the current mark, if any.
Print Opens a standard Windows print dialog, allowing the user to specify how the chart page should be printed. Note that the charts look best when printed in landscape orientation.
Print All Allows you to print all of the charts within the selected mileage range, or a specified subset.
Shift Changes the chart window to location correction mode and displays the Shift Run Dialog (see Location Shifting - Run Alignment).
Options
Single-Click Measurement allows you to specify what information is displayed when using the mouse to click on a chart measurement. Options include mileage and GPS locations.
Actions can also be produced by mouse clicking on the chart window.
Single clicking on the chart draws a circle around the selected point and opens a little dialog stating the measurement, and optionally, the location. This is handy if you are zoomed in and cannot see the axis scale.
If the main run contains profiles, double-clicking on a point brings up the Two-Up Profile window containing the profile clicked on. The Profile window may be re-sized and placed where it is convenient to use with the Chart Window.
Double-clicking on a chart, but not close enough to a point, will bring up profiles near the mileage location clicked on, but not necessarily the ones intended.
Double-clicking beside a chart, not on it, (other than the track curvature chart) opens the Chart Options dialog, which may be used to change the vertical axis scaling or other display properties dynamically, without re-plotting. Click on the left side of the chart to change the primary measurement, or on the right side to change the overlay.
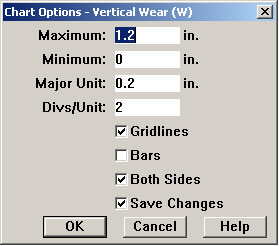
Chart Options Dialog - dynamic version
The dialog contains many of the same options that are available from the measurement Options buttons on the main setup dialog. It allows the user to select whether the changes should be applied to one or both rails, and whether the changes should be saved.
Double-clicking on the track curvature chart in the center of the screen opens the Segment Information Dialog for the curve or tangent section that is clicked on. If another informational dialog was open at the time, it is automatically closed.
Double-clicking on a track point icon or a defect point opens an informational dialog with details about the track point or defect. If another informational dialog was open, it will be closed.
Single-clicking on a run date and number, displayed in the upper-right corner when viewing multiple comparison runs, selects the 'main' run. The run clicked on is then displayed in the 'main run' color; and the previous 'main run' is displayed as a comparison run. This can be used for highlighting a run to distinguish it more easily from others, or to select a run for editing operations.
The horizontal scale of all charts may be changed dynamically by the Chart Location and Scale dialog, called by selecting Location and Scale from the Chart Window menu. It allows the following options to be set:
Start
This sets the starting location of the first set of charts displayed.
Interval
For a more detailed view, charts may be stretched horizontally by entering a lower value for Interval. For an overview, charts may be compressed by entering a higher Interval value.
The Chart Options Dialog for a specific measurement is opened by double-clicking beside a chart. Double-clicking to the left or right of a chart (not on it) displays the dialog with current values for that chart. Values that can be changed are:
Maximum defines the top of the vertical chart axis - usually the highest value to be plotted
Minimum
Minimum defines the bottom of the vertical chart axis - usually the lowest value to be plotted.
Major Unit
The size of a "major unit" on the vertical axis, that is, the space between tick marks that are labeled with measurement values. For example, if the major unit for Head Loss is defined as 5% and Y Min is 0%, then the major tick marks on the vertical axis will be labeled 0, 5, 10.
Divs/Unit
The number of divisions, or "minor units", in each "major unit". Minor units are distinguished by minor tick marks, without labels.
Gridlines
If this is checked, horizontal light grey gridlines mark the major units on the vertical axis.
Bars
Opens the Chart Bars Dialog, allowing horizontal labeled bars to be added or changed.
Both Sides
Check this if there is a corresponding measurement for the opposite side of the track, and you wish to change both sides in the same way.
Save Changes
Check this if you wish your changes to remain in effect the next time you open a chart.