General setup options for track condition charts are set from the Options button at the bottom of the Track Condition Chart Setup dialog.
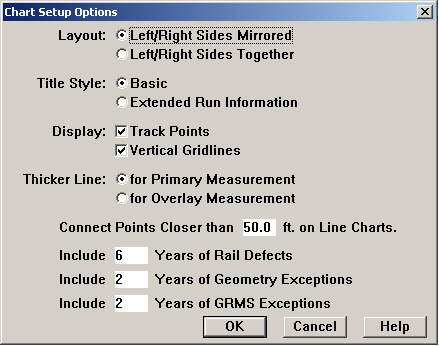
Chart Setup Options Dialog
Layout determines the general layout of the chart page. If left and right sides are mirrored, then measurements specific to the left rail are displayed in the top half of the screen, and the corresponding measurements of the right rail are displayed in the lower half, in inverted order, with the track curvature profile and track points in the middle. If Left/Right Sides Together is chosen, then left-rail measurements are immediately followed by the corresponding right-rail measurements, and the curvature profile appears at the bottom of the screen.
Title Style determines what run information is displayed at the top of the screen. Basic gives you chart titles like those in earlier versions of Rangecam. Extended Run Information includes more attributes from the main run header.
If Display Track Points is checked, track points are shown in picture form below the curvature chart. Only track point types for which pictures are defined will be displayed. The Track Point Type Dialog is used to associate a picture with a point type.
Display Vertical Gridlines turns on vertical hairlines marking location intervals.
Primary and overlay measurements are distinguished by line weight. The Thicker Line allows you to choose which one is heavier.
Connect Points Closer Than allows you to specify a maximum distance for connecting points across a gap in a line chart. If the distance between adjacent points exceeds this value, a line will not be drawn to connect them. The visible gap makes missing data obvious.
The next three options set the default number of years to be included in exception charts.
There are also Options buttons beside each measurement, which allow you to define the vertical axis and display style for the measurement