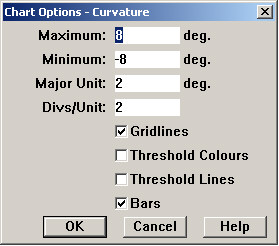
The Options buttons next to each measurement in the Track Condition Chart Setup dialog allow you to define the vertical axis and display style for the measurement. Here are the options for Curvature:
For most measurements, the following options are available:
The highest value of the selected measurement to be plotted. This value defines the top of the vertical chart axis.
The lowest value of the selected measurement to be plotted. This value defines the bottom of the vertical chart axis.
The size of a "major unit" on the vertical axis, that is, the space between tick marks that are labeled with measurement values. For example, if the major unit for Head Loss is defined as 5% and Y Min is 0%, then the major tick marks on the vertical axis will be labeled 0, 5, 10, etc. If gridlines are selected, they are drawn at the same interval.
The number of divisions, or "minor units", in each "major unit". Minor units are distinguished by minor tick marks, without labels.
If checked, horizontal grid lines are drawn at each major unit.
If this is checked for a geometry or GRMS measurement, and exception levels are defined for this measurement in the currently selected Threshold Table, the chart trace is drawn in colors indicating the exception level.
If the box is checked for a rail wear measurement, and wear limits are defined in the Rail Classification Table, the color of the chart trace indicates the classification level for that measurement and rail type.
As an alternative to threshold colors, exception levels for the posted track class (for geometry or GRMS measurements) or for the rail type (for rail wear measurements) can be indicated by colored horizontal lines overlaid on the chart.
This box is checked if chart bars are defined for the measurement. Chart bars are horizontal lines overlaid on the chart to indicate levels of interest to the user, such as standard cant, standard track gauge, or additional exception levels. Chart bars are drawn in black, and are usually labeled. To define or re-define chart bars, click on the check box.
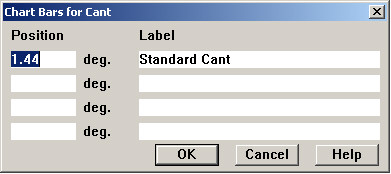
Chart Bars dialog
For exception/defect charts, you can choose which defect severity levels should be displayed.
For charts displayed as discrete points, including rail weights, rail wear classifications, and exceptions, you can specify the shape of the position indicator.