The Track Condition Chart Setup dialog is used to enter chart options and create charts.
The dialog controls the measurements plotted, the overall mileage range displayed, and the location interval displayed on each chart page. It also determines the number of charts created. Charts are compressed vertically to fit on a single screen.
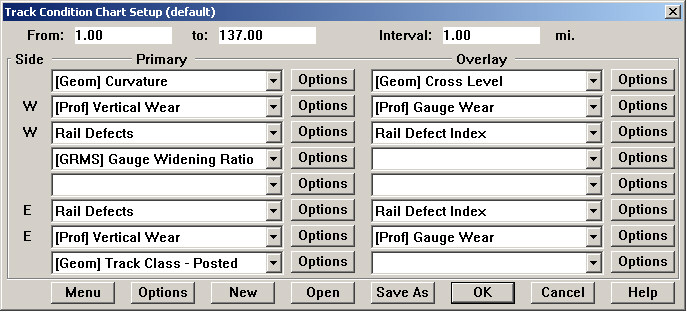
Track Condition Chart Setup Dialog
For From and to, enter the location range to be charted. These will default to the start and end of the current run, rounded to the nearest whole distance unit. Values are entered in scaled distance units.
For Interval, enter the distance to be plotted on each chart page.
From the first drop-down list under Primary, select a measurement for the first chart. If the selected measurement can have different values for left and right rails (such as rail wear, and geometry alignment), it will appear twice in the list, with a compass code indicating the side of the track displayed on the left.
If more charts are desired, select additional measurements under Primary. The size of the charts will be adjusted to fit all the requested charts on one screen or printed page.
You may also select a second measurement for each chart under Overlay. The overlay measurement is displayed on the same chart as the primary measurement beside it. The scale of the primary measurement is shown by the left vertical axis; the scale of the overlay is shown on the right.
The Save As button at the bottom of the dialog allows you save all your chart options as a named chart template. Open is used to retrieve a previously saved template.
The Menu button at the bottom left is used to add the currently specified chart options to the Reports menu on the Map window.
The Options buttons at the bottom of the dialog allows you to specify options affecting the overall chart display.