In the Office System the Map Window is opened by clicking Map on the menu of the Profile View window. The user can select the Map Window or the two-up profile window as the primary interface for Track Analyst. The Map Window is secondary for users of the Rangecam Office System, whose main focus is usually data processing and editing. Users of all products can change their primary interface in the Options Menu. Because the map is designed for data viewing and reporting, not processing and editing, the Office system user is best served by the "classic" Rangecam interface. However, viewing data on the map can greatly help the Office System user ensure data quality.
When the map opens, it prompts the user to select a territory, either a subdivision, a division or the entire railroad. If the data is stored in MS Access, this may not matter much, as most MS Access databases hold just one subdivision or less. If the map has been opened with an Enterprise database for a Class 1 railroad, however, considerable time may be required just to display all tracks. If you intend to work on a specific subdivision, you will save time by selecting it at this stage.
When the map is first displayed, it shows the locations of track, and nothing else. The user determines what additional information is to be shown on the map by using the sidebar and by running queries from the Reports menu. Mileposts, for example, can be displayed by moving the mouse over the Mileposts button on the left-hand sidebar, then clicking Show on the Milepost menu.
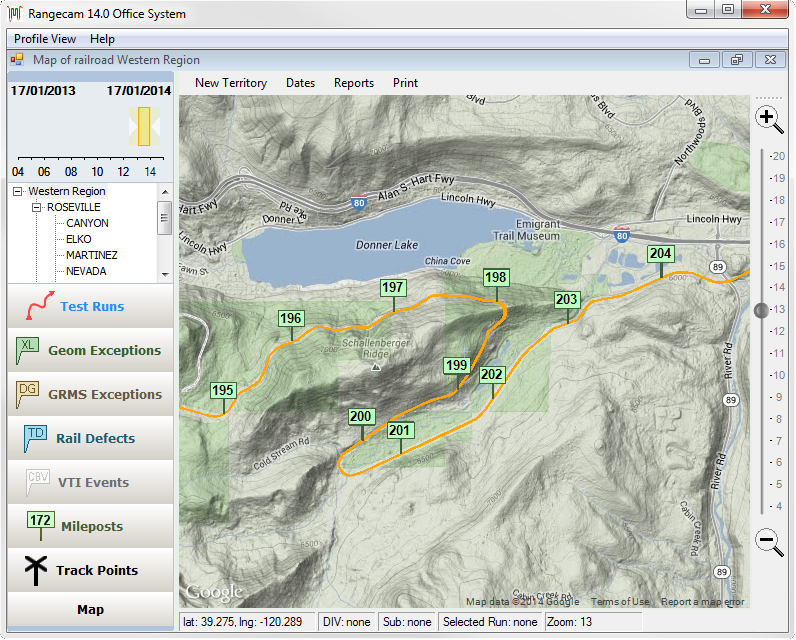
The map, showing track and mileposts on a terrain-model background.
The amount of detail shown on the map depends on the zoom factor. A zoom control appears on the right side of the map. When zoomed tight, all mileposts are shown, but when zoomed out, every 10th or 100th milepost is displayed. Exceptions are displayed with labels when zoomed in, but as unlabeled dots when zoomed out.
If an Internet connection is available, the Map sidebar button may be used to select a Google map as background to the track data. Seeing track condition information in the context of a satellite image or contour map can aid understanding of the causes of degradation. Crossings and access points displayed on the road map are helpful when planning track maintenance.
The map interface was designed to be easy to understand and use. There are just four items on its menubar: New Territory, to create a new map; Dates, to change the date range of track data displayed on the map; Reports, a menu of reports and queries which can be entirely customized to customer needs; and Print.