The Track Segment Performance Comparison Chart is produced by clicking the OK button of the Segment Performance Comparison Setup dialog.
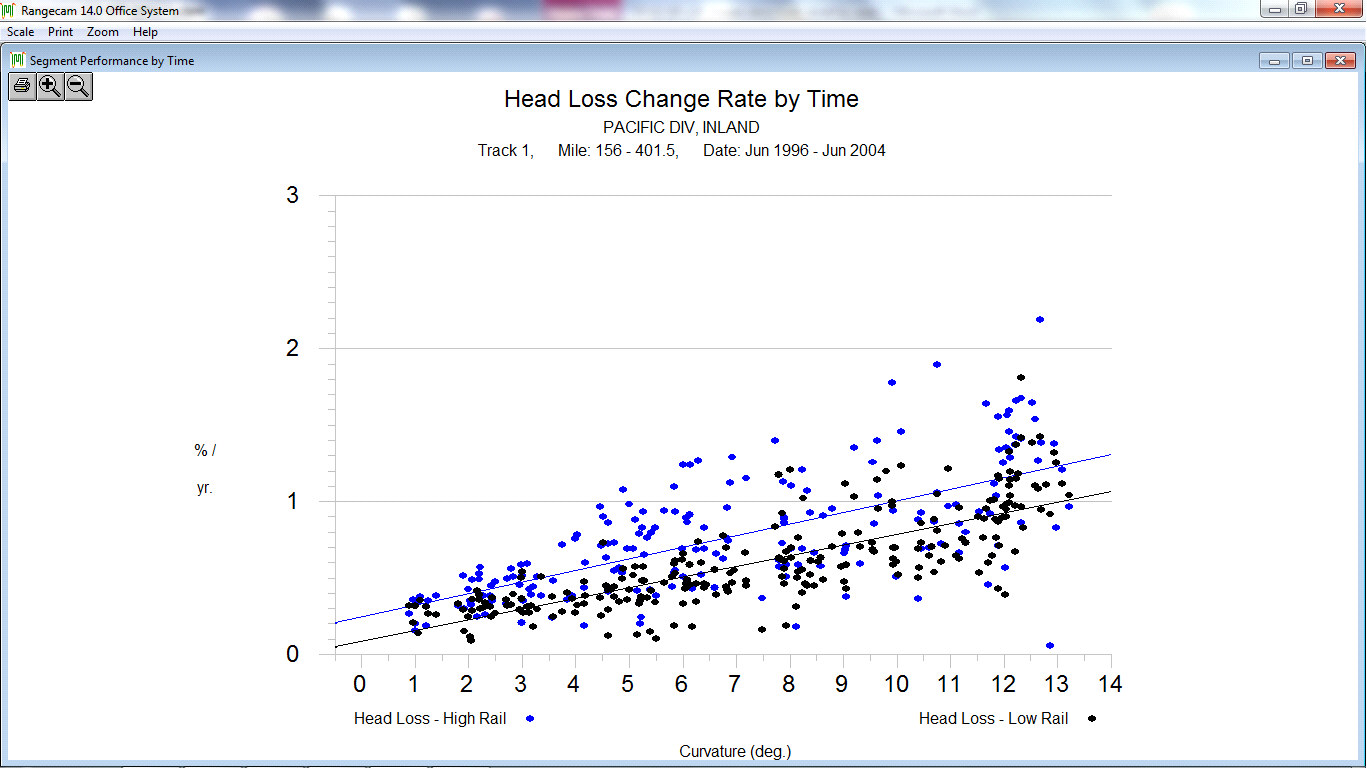
Track Segment Performance Comparison Chart
The wear rate is represented on the vertical axis, curvature on the horizontal axis. Different symbols are used for high rail and low rail wear rates. You may choose these symbols using the Segment Performance Comparison Options Dialog.
If tangent segments are included, the left side is represented by the high rail symbol and the right side by the low rail symbol. Left and right are established by facing the direction of increasing mileage.
If segments were selected using the Track Segment Query, the selection criteria are displayed in the upper left corner.