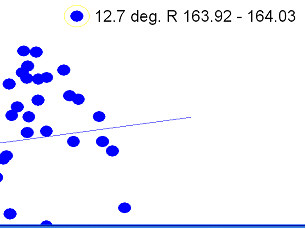
The Track Segment Performance Chart, like the Track Condition Chart, is an active document. You may obtain more information about any curve by clicking on it. A single click shows you curve name and location.

'One-click' curve information
A circle is drawn around the curve that has been clicked on. Information on several curves of interest may be added to the chart by single-clicking. If the chart gets cluttered, you can erase a curve's information by clicking on it again.
Double-clicking on a point produces the same basic curve information, and opens the Track Segment Information Dialog, which allows you to obtain a great deal of further information about the segment.
The menu of the Track Segment Performance Comparison Chart has the following choices:
Scale displays this submenu:
Horizontal opens the Change Curvature Scale Dialog, which allows temporary changes to the horizontal scale, major units, and divisions.
Vertical opens the Change Rate Scale Dialog, which allows temporary changes to the vertical scale, major units, and divisions.
Print opens the standard Windows Print dialog, allowing you to specify how the chart should be printed. Note that the charts look best when printed in landscape orientation.
Zoom displays this submenu:
Mark zooms the window to select as much of the marked region as possible while retaining the horizontal/vertical aspect ratio. To mark a region, click and drag the mouse across the region of interest.
Full resets the window's zoom to its original extent.
Clear Mark This command removes the current mark, if any.
Help provides on-line help for the Track Segment Performance Comparison Chart window
These picture buttons are also available:
![]() Print Prints the contents of the window using default settings.
Print Prints the contents of the window using default settings.
![]() Zoom In (Keypad + key) Zooms in to the marked region.
Zoom In (Keypad + key) Zooms in to the marked region.
![]() Zoom Out (Keypad - key) Zooms out to full-screen display.
Zoom Out (Keypad - key) Zooms out to full-screen display.