The Rangecam Visual Rail Replacement Plan provides a convenient way to visualize and to edit a rail replacement plan as a chart.
First, a rail replacement plan must be calculated. Detailed instructions for producing the plan are found in the topic Rail Replacement Forecast Calculation and Report (see section Reports). Rangecam generates report and visual plan simultaneously and saves them in different files with the same names but different extensions. A Visual Rail Replacement Plan has an extension *.FOC. You can start calculation by selecting a Profile View window and then selecting the menu item Reports/Rail Replacement Forecast/ Plan and Report.
Once a plan is calculated a user can open a Visual Rail Replacement Plan as a chart:
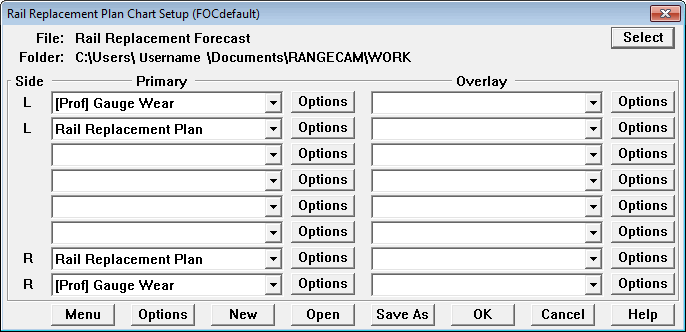
Select the menu item Reports/Visual Rail Replacement Plan Chart... from the Profile View window to open this dialog:

Visual Rail Replacement Plan Chart Setup dialog
Use the Select button to pick a previously generated file with the .FOC file extension. It has the same name as your report file, and is also found in your current work folder.
In the dropdown list select any measurements that you wish to see together with the rail replacement plan, such as gauge wear in example above.
An additional selection called "Rail Replacement Plan" will appear as the last item in the drop-down list of measurements available for charting. Select Rail Replacement Plan either as a primary chart or as an overlay.
Click on the Options button beside Rail Replacement Plan to specify the range of years to display.
Then click OK to produce the charts.

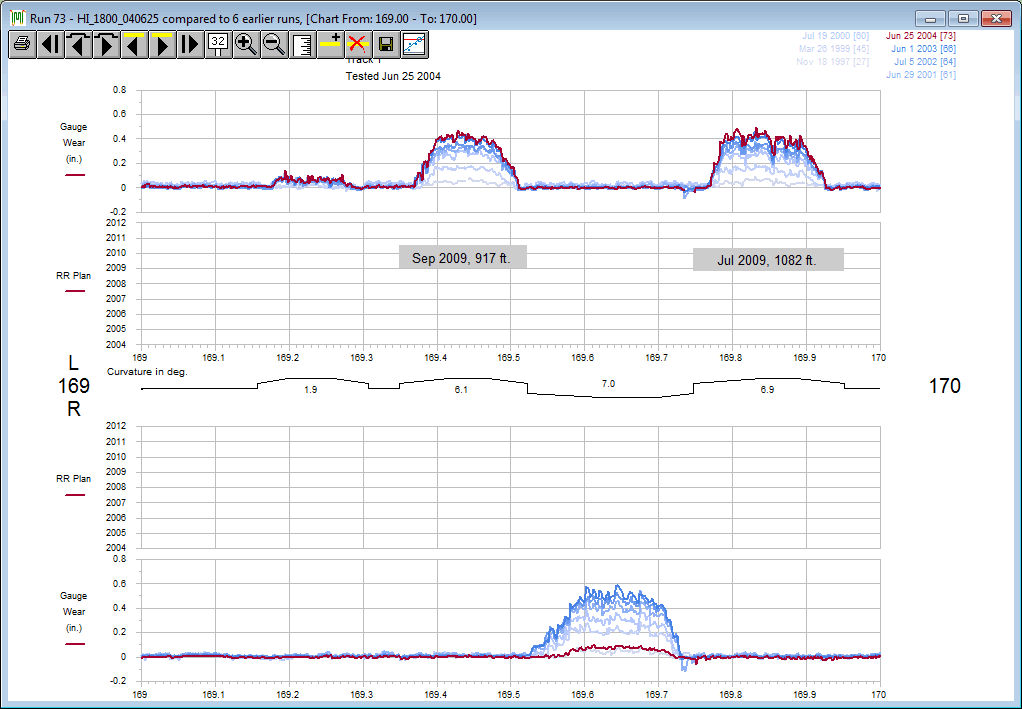
Visual Rail Replacement Plan Chart
Each section of rail to be replaced is shown by a grey bar, marked with the replacement date and length. Replacement dates that are earlier than the minimum date selected in the Rail Replacement Plan Chart Setup are shown on the chart at the minimum date that was selected so that segments with rail that should have been replaced at an earlier date are not overlooked.
The example shows segments selected for replacement due to gauge wear. Comparison runs for several years show how the rail has worn over time.
This chart behaves like the Segment Condition Chart, but has several additional buttons for navigation and editing.
![]() Previous Bar Displays the previous screen containing plan data.
Previous Bar Displays the previous screen containing plan data.
![]() Next Bar Displays the next screen containing plan data.
Next Bar Displays the next screen containing plan data.
![]() Add Bar Allows you to create a new bar (new plan data).
Add Bar Allows you to create a new bar (new plan data).
![]() Delete Bar Deletes the currently selected bar (plan data).
Delete Bar Deletes the currently selected bar (plan data).
![]() Save Saves any changes you have made to the plan.
Save Saves any changes you have made to the plan.
The plan navigation buttons, ![]() and
and ![]() , allow you to skip sections of track where no rail needs to be replaced. If you want to view the data in between, or add new bars, use the
, allow you to skip sections of track where no rail needs to be replaced. If you want to view the data in between, or add new bars, use the ![]() and
and ![]() buttons instead.
buttons instead.
The Print All
menu pick allows you to print the entire plan - i.e. all chart pages that can be reached by navigating with the ![]() and
and ![]() buttons. Selected page ranges can be printed.
buttons. Selected page ranges can be printed.
![]() Trend Chart Opens Rail Wear Trend Chart for selected plan data.
Trend Chart Opens Rail Wear Trend Chart for selected plan data.